For businesses, the break even point is a crucial element of any financial assessment. To ensure your business is on track with it’s finances, it’s imperative that the break-even point is calculated accurately and taken into account of the overall company finances.
Break Even Point Navigation
- What is the break-even point?
- How do you read a break-even chart?
- What even formula in business?
- Step by step BEP chart
- What increases the break even point?
- What if the break-even point is negative?
What Is the Break-Even Point (BEP)?
The break-even point is the point at which a company’s income is equal to their costs. Determining the break-even point informs a business whether they’re operating at a loss or a profit. The break-even point can be calculated by dividing the total costs affiliated with production, by the revenue per individual unit, minus the variable expenses per unit.
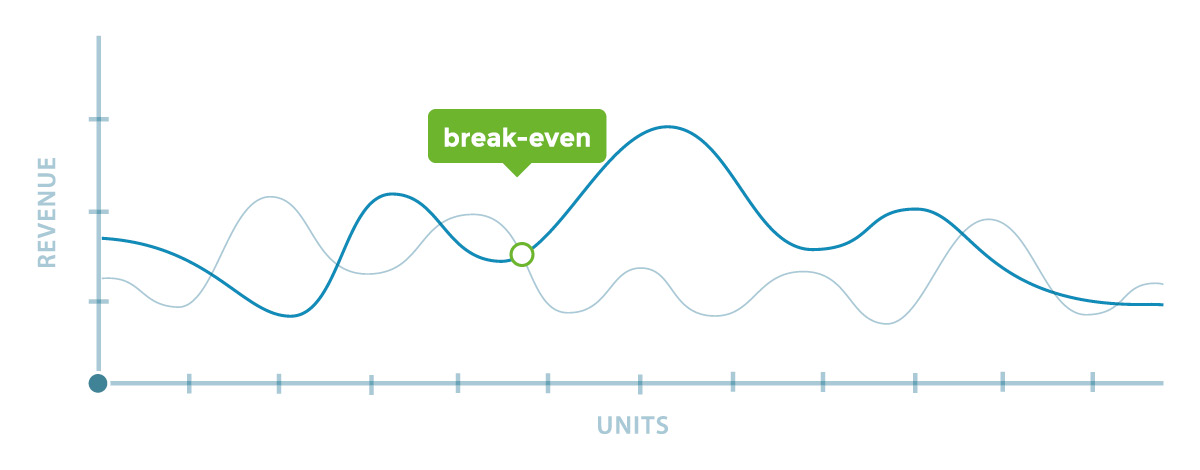
How Do You Read a Break-Even Chart?
You can interpret a break-even chart by locating the point where the total costs of the business meets the line for total revenue. This is the point where the costs and revenue are equal. Everything below this point is produced at a loss and everything above this point is produced at a profit.
What is the Break Even Formula in Business?
The break-even point can be determined through the following formula:
FIXED COSTS ÷ (SALES PRICE PER UNIT – VARIABLE COSTS PER UNIT)
Fixed costs are the expenses that do not fluctuate (for example monthly rent).
Variable costs are expenses that are directly affiliated with production (for example wages and raw materials).
Sales price is what is charged for one unit.
How Do You Create a Break-Even Chart? – A Step by Step Guide
Here is a breakdown on how to easily create your business break even chart.
1. Basic Axis
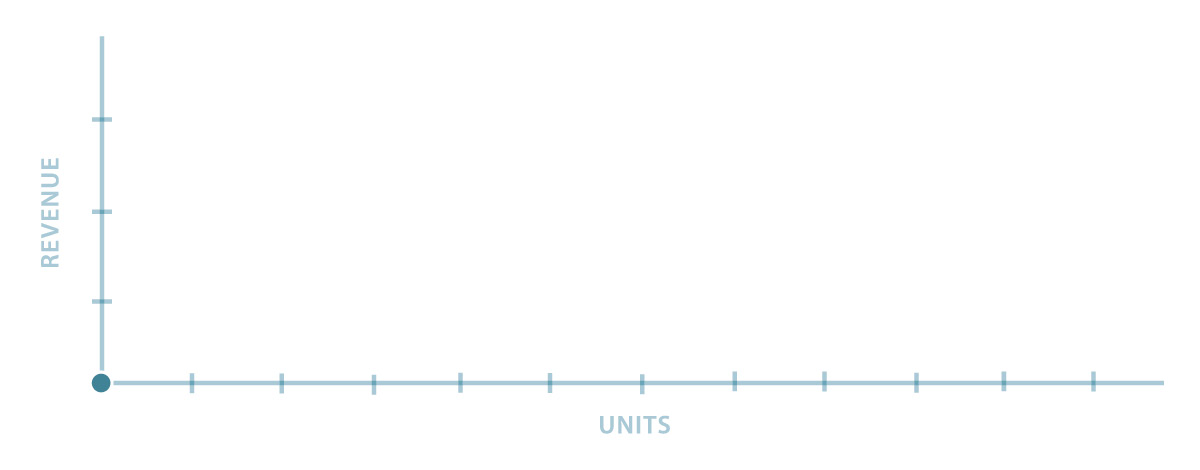
To construct a break-even chart, you must begin with a basic axis with unit output on the horizontal axis and costs and revenue on the vertical axis.
2. Fixed Cost Line
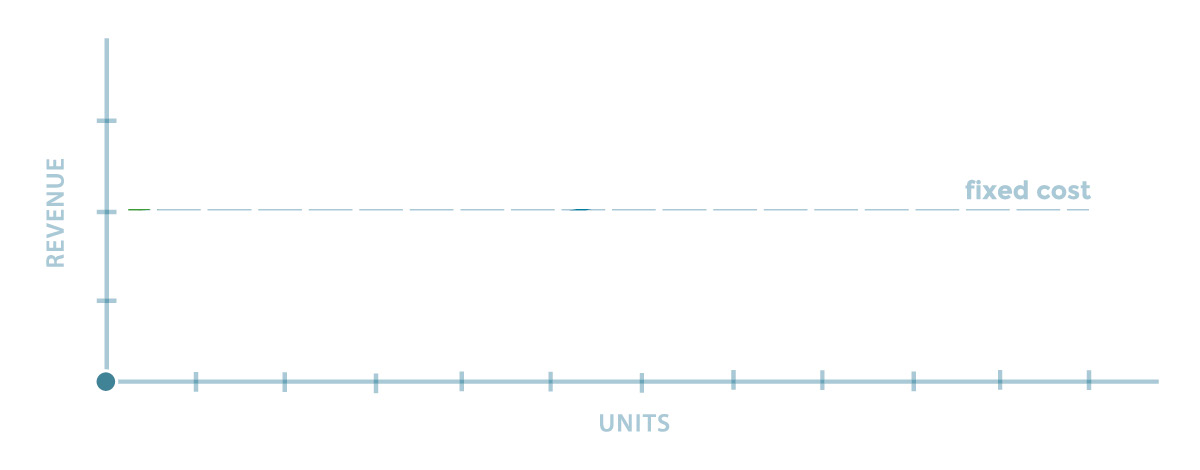
Secondly, you must plot the fixed costs line – this will be a horizontal line as the costs are permanently fixed at a given figure, regardless of the product output.
3. Variable Costs
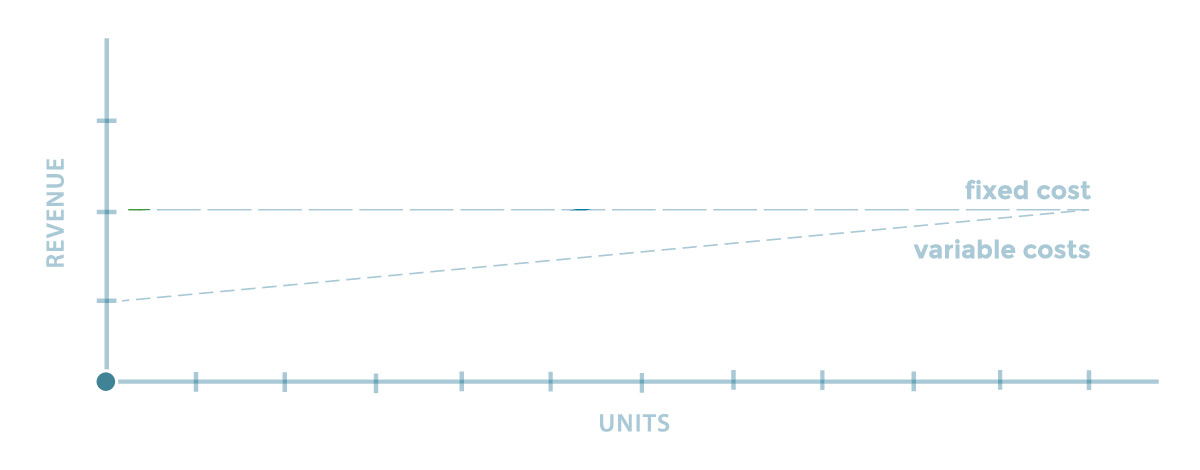
With your fixed costs plotted, it is now possible to plot the variable costs – this is found by calculating the variable costs per unit multiplied by the number of units sold. Therefore this will be a diagonal line as it is directly proportional to the output. Note that the addition of this line is not always essential but allows all the information to be seen.
4. Total Costs
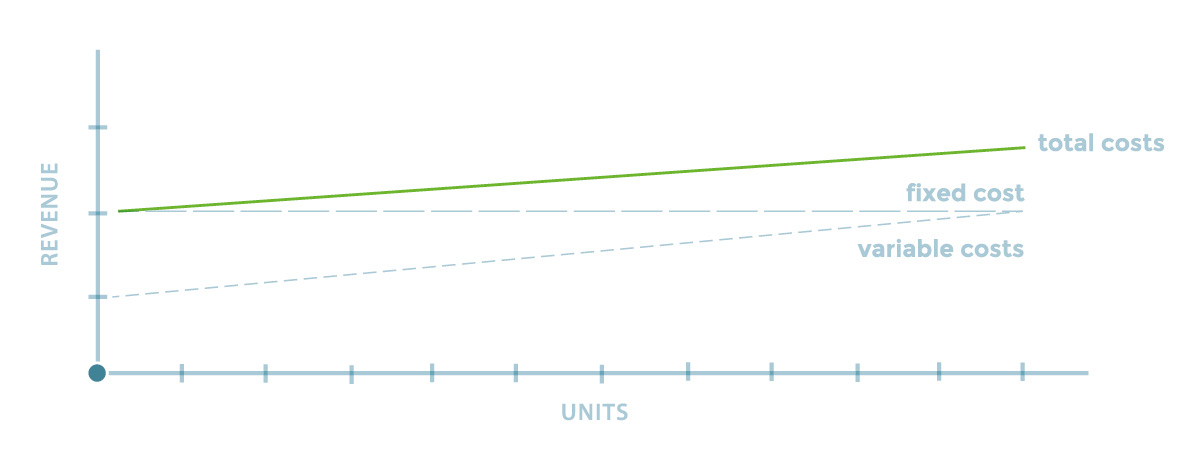
Now the total costs line must be added – this is the value of the fixed costs and variable costs combined and is essential to calculating the break-even point.
5. Total Revenue

With all the cost lines plotted, the total revenue line can be added. To calculate total revenue multiply the sales price per unit and the total output.
6. Interpret The Break-Even Point
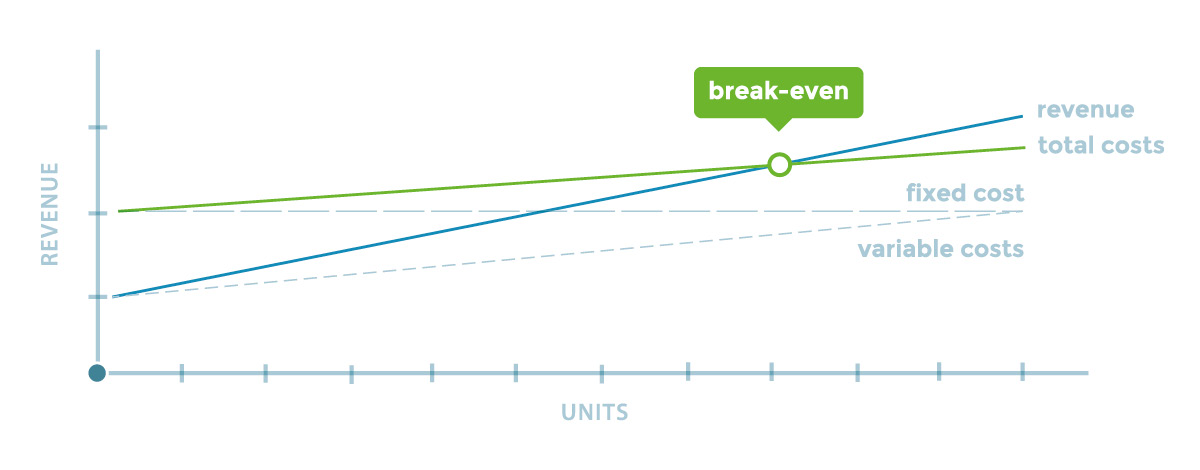
Your break-even chart is now complete with the information required to interpret the break-even point! The point where the total revenue line and the total costs line meet is your break-even point.
What increases the break-even point?
An increase in the break-even point could be caused by a few factors, including an increase in the fixed costs (for example if the rent of the building increases) or if the variable costs become greater, without a corresponding increase in sale price (for example if materials become more expensive).
A rise in fixed costs would cause an increase in the total costs, which by extension raises the break-even point, if revenue remains constant.
Moreover, a rise in variable costs would have a similar effect as the total costs would inflate. Without an increase in sales price, the revenue would remain the same and the break even-point would increase.
In both instances, the company would have to sell more units in order to meet their costs and break even, or would be operating at a loss.
Strategies to combat this increase in costs would be to raise the selling price per unit, thus decreasing the effect an increase in costs would have on the break-even point, as this would allow the company to meet the additional costs of the raw materials (variable cost) or rent (fixed cost).
What if the break-even point is negative?
If the break even point is negative, this would demonstrate that the company’s total costs outweigh the sales revenue. In other words, the business is operating at a loss.
To combat this problem, the business would either have to sell more units or raise the selling price of their product to increase their revenue, decrease their break-even point and increase their profitability.
Select FastPay as your Direct Debit Solution
Ensuring your business has a superior Direct Debit solution is key to cashflow management and knowing the ins and outs of your business finances.
Get in touch with a member of our team today by contacting us online or alternatively, you can call 0161 737 5290.